

Ask three plant managers for their OEE and you will often get three numbers worked out three different ways. That is the quiet problem with Overall Equipment Effectiveness: it is the most-cited number on the factory floor and one of the most misread. A line running at “90% efficiency” on the shift report can hide an OEE closer to 55% once you account for the speed it lost and the parts it scrapped.
The OEE formula fixes that by forcing one honest question: of all the time you planned to make good parts, how much of it actually produced good parts at full speed? Get the inputs right and OEE becomes a diagnostic you can act on. Get them wrong and it becomes a vanity metric that flatters a struggling line.
This guide gives you the formula, a fully worked calculation from a single shift, the world-class benchmarks to measure against, and a factor-by-factor plan for moving the number. No jargon, just the math and what to do with it.
Direct answer — What is the OEE formula?
The OEE formula is Availability × Performance × Quality. Availability is run time divided by planned production time, Performance is actual output divided by the theoretical output at ideal speed, and Quality is good parts divided by total parts. Multiplying the three gives OEE, the percentage of planned production time spent making good parts at full rate. World-class OEE is about 85%.
Key Takeaways
- OEE = Availability × Performance × Quality. Each factor is a rate between 0 and 100%, and multiplying them punishes a weak link hard: three “okay” 90% factors still net just 73%.
- You need five inputs: planned production time, run time, ideal cycle time, total count, and good count. Everything in the formula comes from those.
- World-class OEE is 85% (Availability 90% × Performance 95% × Quality 99.9%). Most plants sit near 60%, and discrete manufacturing averaged 66.8% across nine sectors in 2025.
- OEE measures planned production time only. TEEP stretches the same math across every hour on the calendar to expose hidden capacity.
- Every point of lost OEE traces to one of the Six Big Losses, which is why the formula doubles as an improvement map.
What is OEE (Overall Equipment Effectiveness)?
OEE, or Overall Equipment Effectiveness, is a standard manufacturing metric that measures the percentage of planned production time that is fully productive, meaning good parts made at the maximum rate with no stop time. A score of 100% means you produced only good parts, as fast as the equipment allows, with zero downtime.
The metric earns its keep by folding three separate failure modes into one figure. A machine can be available but slow, fast but scrapping parts, or perfect but idle half the shift. Track any one of those alone and you miss the other two. OEE rolls availability, speed, and quality into a single percentage that a plant owner and a machine operator can both read the same way.
OEE started inside Total Productive Maintenance (TPM) in the 1970s and has become the default scoreboard for lean and continuous-improvement programs. On a modern line the number is rarely calculated by hand. It comes off the equipment through a manufacturing execution system that reads run time and counts straight from the machine, so the OEE on the dashboard reflects what the line actually did rather than what a clipboard remembered.
The OEE formula: Availability × Performance × Quality
The OEE formula multiplies three rates, each of which answers a different question about the same block of planned time. Written out, it is short.
OEE = Availability × Performance × QualityBecause the three factors multiply rather than average, OEE is unforgiving. A line at 90% availability, 90% performance, and 90% quality does not score 90%. It scores 0.9 × 0.9 × 0.9, which is 72.9%. That multiplication is the whole point: it stops a strong factor from hiding a weak one.
Availability
Availability is the share of planned production time the equipment was actually running. It falls whenever the line stops, whether for a breakdown, a material shortage, or a changeover. The unplanned breakdowns in that list are exactly what predictive maintenance software that catches the breakdown early exists to prevent. It also climbs when you add run time no shift schedule can, which is why handing a dull machine-tending job to a cobot raises Availability without adding a second shift of people.
Availability = Run Time ÷ Planned Production TimePlanned production time is the shift minus scheduled breaks; run time is planned production time minus every stop, planned or not. The gap between them is downtime, which is exactly what a CMMS that schedules preventive maintenance and shortens repairs is built to shrink. Cut the stops and Availability climbs directly.
Performance
Performance is how close the line ran to its ideal speed while it was running. It drops through minor stops, idling, and cycles that run slower than the machine’s rated rate.
Performance = (Ideal Cycle Time × Total Count) ÷ Run TimeIdeal cycle time is the fastest sustainable time to make one part. Multiply it by every part you made and you get the time the run should have taken; divide by the time it actually took and you have Performance. A number over 100% here always means the ideal cycle time is set too slow, not that the line broke physics.
Quality
Quality is the share of parts that came out good the first time, with no rework or scrap.
Quality = Good Count ÷ Total CountOnly first-pass good parts count. A part that gets reworked into a sellable unit still counts against Quality, because it consumed capacity the line will not get back. That is why reject and rework data belongs inside the OEE calculation, not off to the side. It is also why plants push the check upstream, since a machine vision system that flags a bad part before it becomes scrap protects the Quality factor at the source instead of just counting the loss afterward. Catching the bad part protects the score, but keeping it from recurring is a separate job that belongs to a Pareto chart and the root-cause tools behind it, which turn a stubborn reject rate into the one cause worth fixing first.

How to calculate OEE: a worked example
To calculate OEE, gather five numbers from one production run, work out the three factors, then multiply them. Here is a full calculation for a single eight-hour shift, using the standard reference figures from Vorne’s OEE model.
| Input | Value |
|---|---|
| Shift length | 8 hours (480 min) |
| Scheduled breaks | 60 min |
| Planned production time | 420 min |
| Down time (all stops) | 47 min |
| Run time | 373 min |
| Ideal cycle time | 1.0 second per part |
| Total count | 19,271 parts |
| Reject count | 423 parts |
| Good count | 18,848 parts |
With those inputs, each factor falls straight out of its formula, using the numbers from Vorne’s reference OEE calculation:
373 min ÷ 420 min = 0.8881 (88.81%)(1.0 s × 19,271) ÷ (373 min × 60 s) = 0.8611 (86.11%)18,848 ÷ 19,271 = 0.9780 (97.80%)0.8881 × 0.8611 × 0.9780 = 0.7479 (74.79%)The shift ran at 74.79% OEE. Read the factors and the story is clear: Availability and Performance each shed roughly 12 to 14 points, while Quality held up well. The 423 rejected parts pulled Quality to 97.80%, and closing that kind of gap is the everyday work of a quality management system that catches defects at the source rather than at final inspection.
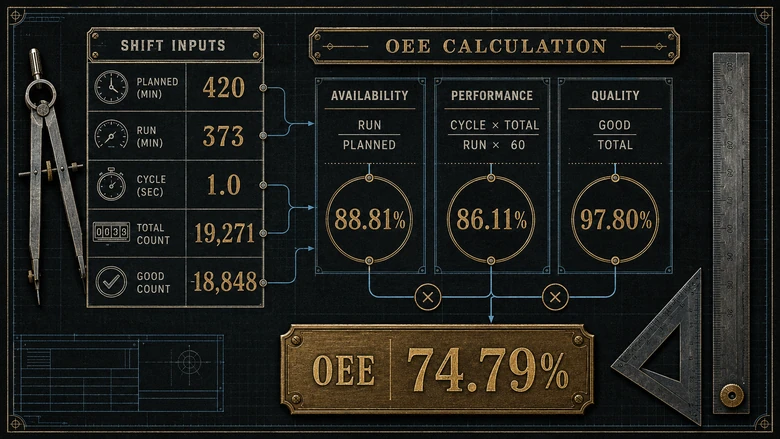
There is a shortcut that lands on the same answer. Because the three factors share terms, OEE also equals good parts times ideal cycle time, divided by planned production time.
OEE = (Good Count × Ideal Cycle Time) ÷ Planned Production TimeRunning the numbers gives (18,848 × 1.0 s) ÷ (420 min × 60 s) = 18,848 ÷ 25,200 = 0.7479, the same 74.79%. The short form is faster to compute; the three-factor form is the one that tells you where the loss lives. Use the long form when you want to fix something.
What is a good OEE score?
A good OEE score depends on your process, but the reference points are simple: 100% is perfect production, 85% is world-class for discrete manufacturers, 60% is fairly typical, and 40% is low but common for lines that have never been measured. The benchmarks below come from Vorne’s world-class OEE research.
| OEE score | Rating | What it means |
|---|---|---|
| 100% | Perfect | Only good parts, as fast as possible, no stop time |
| 85% or higher | World-class | A realistic long-term target for discrete manufacturing |
| 60% | Typical | Common for plants with real room to improve |
| 40% | Low | Common for lines with no OEE tracking yet |
World-class OEE of 85% is not one strong factor carrying the rest. It comes from Availability of 90%, Performance of 95%, and Quality of 99.9%, all at once. Multiply those and you land on 85%, which is why the mark is hard to hit: you have to be excellent on three fronts, not one. Holding a Quality rate that high is less about final inspection than about seeing a process start to drift before it makes scrap, which is the everyday job of a control chart that separates a real shift from normal noise.
Averages tell a sobering story. Across 1,470 discrete manufacturing operations measured in 2025, OEE averaged 66.8%, ranging from 78.2% in medical devices down to 57.2% for trailers and RVs. Most plants, in other words, leave a third of their planned capacity on the floor. The distance between a typical 60% and a world-class 85% is not a rounding error; it is often the equivalent of an extra production line you already own but do not run. That lost third has a name on the floor: it is the eight wastes of lean in disguise, and hunting them down is how you win the capacity back.
Chasing that gap has a cost worth sizing before you sign a purchase order, because the OEE software and sensors that measure the number properly are themselves a line item worth understanding before you buy. A number you cannot trust is worse than no number, so the tracking has to be solid before the target means anything.
OEE vs TEEP: what OEE leaves out
OEE measures only planned production time, so it deliberately ignores the hours you chose not to run. TEEP, or Total Effective Equipment Performance, closes that blind spot by measuring the same three factors against every hour on the calendar.
The bridge between them is Utilization, the share of all calendar time that you scheduled as planned production time.
TEEP = OEE × UtilizationAn example makes the difference concrete. A line running a single 8-hour shift five days a week is scheduled for 40 of the 168 hours in a week, a Utilization of about 24%. Even a world-class 85% OEE then translates to a TEEP near 20%, which reframes the question from “how good is this shift?” to “how much of this asset am I using at all?”
| Metric | Time base | Best question it answers |
|---|---|---|
| OEE | Planned production time only | How productive is the time we chose to run? |
| TEEP | All calendar time (24/7) | How much of this asset’s full capacity are we using? |
Use OEE to improve a shift and TEEP to decide whether you need another one. A high OEE with a low TEEP is a signal that you may be able to take on more work without buying a single new machine, just by scheduling the hours you already have.
The Six Big Losses behind a low OEE
Every point OEE loses maps to one of the Six Big Losses, the standard breakdown that turns the score into a to-do list. Each loss lands under one of the three factors, which tells you exactly which lever to pull.
| Factor | Loss | Example |
|---|---|---|
| Availability | Unplanned stops | Breakdowns, tooling failures, material shortages |
| Availability | Planned stops | Changeovers, setup, adjustments |
| Performance | Small stops | Minor jams, misfeeds, brief idling under five minutes |
| Performance | Slow cycles | Running below rated speed, worn tooling |
| Quality | Production rejects | Scrap and rework during stable running |
| Quality | Startup rejects | Defects during warm-up or right after a changeover |
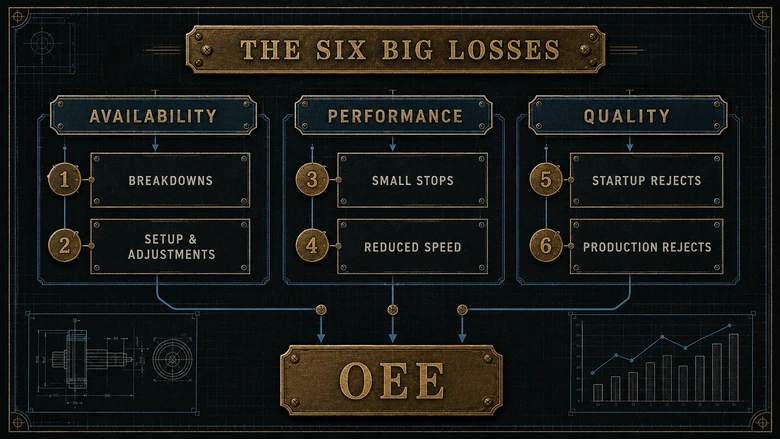
The value of the framework is triage. Once you know that unplanned stops cost you eight points of Availability while slow cycles cost three points of Performance, you stop guessing and start with the loss that is actually largest. Most lines find that one or two of the six dominate, and that the biggest loss is rarely the one people complain about most.
IMPORTANT
Measure the losses before you fix them. A team that “knows” its problem is changeovers will often find, once the data is on the board, that small stops and slow cycles are quietly costing more. OEE is only as honest as the stop reasons your operators actually record.
How to improve OEE, factor by factor
To improve OEE, work the three factors separately, because the fix for a stopped line, a slow line, and a scrapping line are not the same. Start with whichever factor sits furthest from its world-class mark.
Improve Availability
Availability responds to two moves: fewer breakdowns and faster changeovers. Preventive and predictive maintenance cut the unplanned stops, while SMED (single-minute exchange of die) attacks the planned ones by turning hour-long changeovers into minutes. A shift from reactive to scheduled maintenance is usually the single biggest Availability win a plant can make.
Improve Performance
Performance is lost in small increments that rarely show up on a stop report: a few seconds of idling here, a slightly slow cycle there. The fixes are catching minor stops with better sensors and operator response, right-sizing ideal cycle times to reality, and smoothing flow so machines are not starved or blocked. Tighter production scheduling that keeps the right job on the right machine removes a surprising amount of the idling that quietly drains Performance.
Improve Quality
Quality gains come from catching defects earlier and stopping them from recurring. Statistical process control (SPC), mistake-proofing (poka-yoke), and fast feedback on the first parts after a changeover all cut the reject and startup losses. Because rework counts against Quality just like scrap does, the goal is first-pass yield, not just shippable output. When the same defects keep recurring, a Pareto chart and the root-cause tools behind it point to the vital few causes to fix first.
PRO TIP
Improve one factor at a time, and hold the OEE calculation constant while you do. If you change how you count stops and change a process in the same week, you will not know which move shifted the number. Fix the measurement first, then the process.
None of this works without honest measurement, which is where OEE software earns its place: real-time capture of stops, speeds, and rejects turns a monthly average into a live signal the floor can act on within the same shift. The math is simple, but the discipline of feeding it clean data every shift is what separates a plant that talks about OEE from one that moves it.
OEE is a diagnostic, not a scoreboard. The formula, Availability times Performance times Quality, is worth committing to memory, but the number it produces only matters if you read the three factors underneath it and act on the largest loss. Measure one shift honestly, find your biggest gap, and close that one first. That is how a 60% line becomes an 85% line, one factor at a time.
Frequently Asked Questions
The OEE formula is Availability × Performance × Quality. Availability is run time divided by planned production time, Performance is actual output divided by output at ideal speed, and Quality is good parts divided by total parts. Multiplying the three gives the percentage of planned time spent making good parts at full rate.
Collect five numbers from one run: planned production time, run time, ideal cycle time, total count, and good count. Compute Availability (run time ÷ planned time), Performance (ideal cycle time × total count ÷ run time), and Quality (good ÷ total), then multiply all three. A 373-minute run of 18,848 good parts scores about 74.8%.
For discrete manufacturing, 85% OEE is considered world-class, 60% is typical, and 40% is common for lines that have never tracked it. In 2025, discrete manufacturers averaged 66.8%. A good score is relative, so most plants aim to beat their own baseline before chasing the 85% benchmark.
OEE stands for Overall Equipment Effectiveness. It is a manufacturing metric that measures the percentage of planned production time that is fully productive, combining availability, performance (speed), and quality into one number. A 100% OEE means only good parts were made, at full speed, with no downtime.
OEE measures only planned production time, while TEEP (Total Effective Equipment Performance) measures the same three factors against all 168 hours in a week. TEEP equals OEE × Utilization. Use OEE to improve a running shift and TEEP to reveal how much total capacity an asset still has spare.