
Strategic sourcing is what separates a supplier decision from a price comparison. A low quote can still be the expensive choice when it brings unstable quality, late deliveries, premium freight, slow corrective action, or a capacity constraint that appears only after demand rises.
The decision also sits upstream of execution. Sales and operations planning defines what the business expects to sell and make; sourcing decides which external capabilities can support that plan. The purchase order comes later. If the supplier strategy is weak, a perfect transaction cannot rescue it.
This guide gives manufacturers a working system: segment spend, choose a strategy with the Kraljic matrix, run a seven-step sourcing cycle, issue comparable RFx documents, score evidence with a 100-point model, normalize total cost, and manage the relationship after award.
Direct answer — What is strategic sourcing?
Strategic sourcing is a structured, cross-functional process for deciding what a company should buy, how it should buy it, and which suppliers can deliver the best long-term value. It analyzes spend, supply markets, capability, quality, capacity, total cost, and risk before award, then monitors supplier performance after contracting. Unlike routine purchasing, it treats supplier choice as an operating decision rather than a one-time price event.
Key Takeaways
- Segment spend before contacting suppliers. A catalog fastener, a sole-source casting, and a custom control board should not follow the same sourcing strategy.
- Set hard qualification gates before weighted scoring. A supplier that cannot meet a regulatory, capacity, or technical requirement should not win by earning points elsewhere.
- Compare total cost of ownership, not quoted unit price. Quality loss, inventory, freight, tooling, payment terms, and disruption exposure can reverse the apparent winner.
- Use evidence for every score. Audit records, capacity calculations, control plans, delivery history, and financial checks are stronger than a polished presentation.
- The award starts supplier management; it does not finish sourcing. Contracts, onboarding, scorecards, corrective actions, and quarterly reviews keep the decision valid.
Why strategic sourcing starts before the supplier search
Manufacturers often begin with a familiar supplier list and ask for three quotes. That produces three prices, not necessarily three qualified options. The earlier work is to define the demand, critical requirements, switching constraints, and business exposure. A sourcing team cannot evaluate supply until engineering, quality, operations, finance, and procurement agree on what failure would cost.
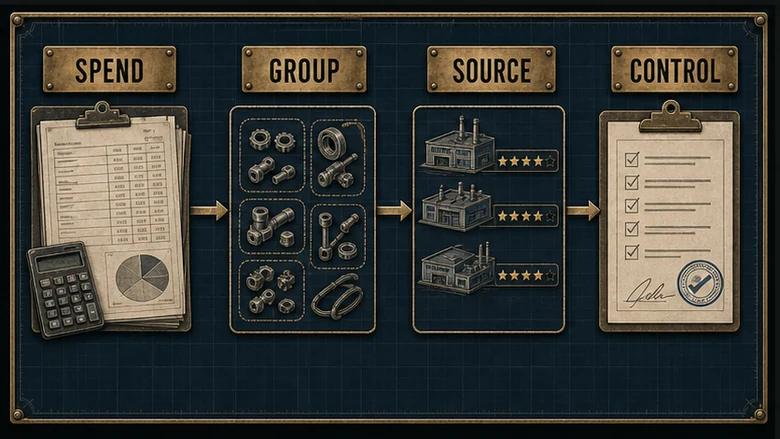
The first data set is a spend cube: supplier, category or part family, plant, business unit, annual spend, volume, and time. Clean supplier names, separate one-time tooling from recurring material, and connect purchase history to the bill of materials. Then add operational facts: lead time, defect history, expediting, inventory, capacity commitments, and sole-source flags. This exposes categories that look small in spend but can stop a high-value product.
Current conditions reinforce that distinction. The U.S. Census Bureau reported in July 2026 that May manufacturing unfilled orders reached $1.5795 trillion while inventories were $962.0 billion. Those economy-wide figures do not set a policy for one plant, but they show why open-order exposure and inventory cannot be reduced to a single unit-price target. A sourcing event needs the demand and inventory assumptions used in manufacturing inventory management.
Use the Kraljic matrix to choose the sourcing strategy
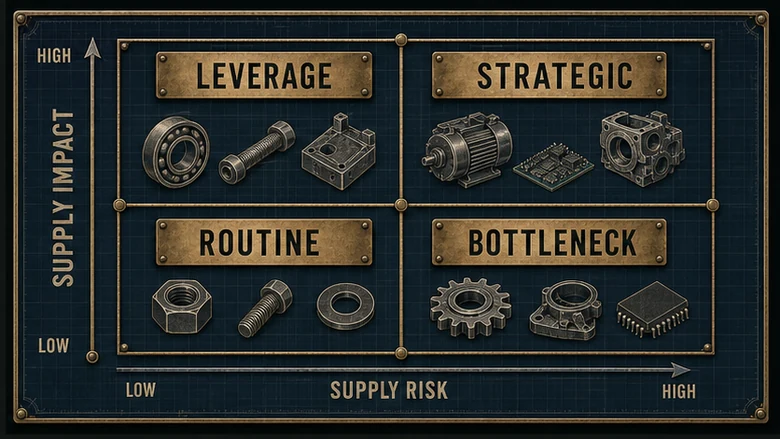
The Kraljic matrix places a purchase category on two axes: profit or operational impact, and supply risk. “Impact” includes more than spend; it can include line-stop cost, warranty exposure, regulatory importance, and customer concentration. “Risk” includes supplier scarcity, qualification time, tooling ownership, geographic concentration, switching cost, and capacity tightness.
| Quadrant | Typical manufacturing example | Primary sourcing strategy | What not to optimize first |
|---|---|---|---|
| Non-critical | Standard office and maintenance consumables with many substitutes | Automate ordering, consolidate vendors, reduce transaction cost | Lengthy custom negotiations |
| High-impact / low-risk | High-spend standard resin, sheet, packaging, or common components | Aggregate volume, create competition, negotiate indexed terms | Relationship depth without measurable value |
| Bottleneck | Low-spend proprietary sensor, legacy electronic part, or approved chemical | Secure supply, hold targeted buffers, qualify alternates, redesign where possible | Small price reductions that increase fragility |
| Strategic | Custom casting, safety-critical assembly, sole-source chip, or contract manufacturing partner | Joint capacity planning, executive governance, open risk work, long-term improvement | Annual rebidding as the default |
The matrix is a decision frame, not a permanent label. A common component can move from competitive buying to bottleneck status after a plant closure or specification change. A strategic part can become a competitive category after a redesign creates qualified alternatives. Review the placement when demand, design, regulation, tariffs, capacity, or supplier ownership changes.
The seven-step strategic sourcing process
1. Build the baseline and segment the category
Establish twelve to twenty-four months of quantity, price, usage, supplier, plant, freight, quality, and expedite data. Correct units of measure and duplicate vendor names. Separate recurring spend from prototypes, emergency buys, tooling, and capital equipment. The baseline becomes the “before” state against which savings, service, and risk changes will be measured.
2. Define requirements and hard gates
Translate the need into measurable requirements: drawing and revision, material, tolerance, test method, certifications, approved sub-tier constraints, forecast range, minimum order quantity, packaging, traceability, delivery window, data exchange, warranty, and change-notification rules. Mark non-negotiable gates. A medical certificate, PPAP capability, clean-room process, export-control condition, or surge capacity may eliminate a bidder before scoring.
3. Analyze the supply market
Identify capable incumbents and challengers, regional capacity, raw-material dependencies, substitute processes, concentration, and entry barriers. NIST’s MEP supplier-scouting network is one route for U.S. manufacturers that need domestic capability discovery. Market analysis should produce a realistic bidder pool, not a directory of companies that happen to mention the process.
4. Select a category strategy
Choose the commercial and risk approach before launching the event: consolidate or diversify, single-source or dual-source, localize or retain a global mix, renegotiate or switch, buy finished parts or change the make/buy boundary. State the decision hypothesis and what evidence could disprove it. This keeps the team from rewriting the strategy around a preferred bidder.
5. Run RFI, RFP, or RFQ in the right sequence
Use an RFI when capability and market structure are uncertain, an RFP when suppliers may solve the requirement differently, and an RFQ when the specification, quantity, terms, and comparison basis are controlled. Do not ask for a fixed quote while engineering is still changing the design. Every bidder should receive the same revision, forecast, assumptions, response template, and question log.
6. Evaluate, negotiate, contract, and award
Apply hard gates first, then score technical, quality, delivery, cost, capacity, and risk evidence. Normalize currencies, freight, duties, tooling, payment terms, and escalation clauses. Negotiate the complete operating agreement: service levels, price mechanics, forecast liability, intellectual property, audit rights, change control, business continuity, corrective action, termination, and tooling disposition.
7. Transition and monitor the supplier
Build a controlled handoff from award to operation. Approve samples or first articles, complete audits, validate packaging and logistics, load master data, agree contacts and escalation paths, and stage the old supplier’s exit. The downstream procure-to-pay process executes requisitions, purchase orders, receipts, invoices, and payment; it should enforce the source, price, terms, and controls created here.
Write an RFx that returns comparable answers
A weak RFQ asks for “best price and lead time.” A useful package gives bidders the same demand profile and forces the cost and capability assumptions into named fields. Include annual volume, release pattern, lot sizes, forecast range, delivery point, Incoterm, currency, payment term, tooling ownership, quality requirements, required documents, quote validity, escalation formula, and exceptions register.
For manufactured parts, attach controlled drawings, models, specifications, approved-material rules, inspection expectations, packaging, and change history. State whether quoted capacity is reserved or merely available today. Ask suppliers to show bottleneck equipment, current utilization, cycle-time basis, staffing assumptions, maintenance contingency, alternate site, and the time needed to reach the proposed run rate.
Use one response workbook or portal structure. If Supplier A includes freight, Supplier B excludes tooling, and Supplier C assumes a different annual volume, the quoted totals are not alternatives. Normalize them before negotiation and document every adjustment. The goal is not to make suppliers identical; it is to make differences visible.
The FI 100-point manufacturing supplier scorecard
Scorecards should reflect the category. The weights below are a defensible starting point for a production component, not a universal standard. Define the evidence and scoring anchors before opening bids. Keep pass/fail gates outside the weighted total so an unqualified supplier cannot compensate for a missing requirement with a lower price.
| Criterion | Weight | Evidence to request | 1-point anchor | 5-point anchor |
|---|---|---|---|---|
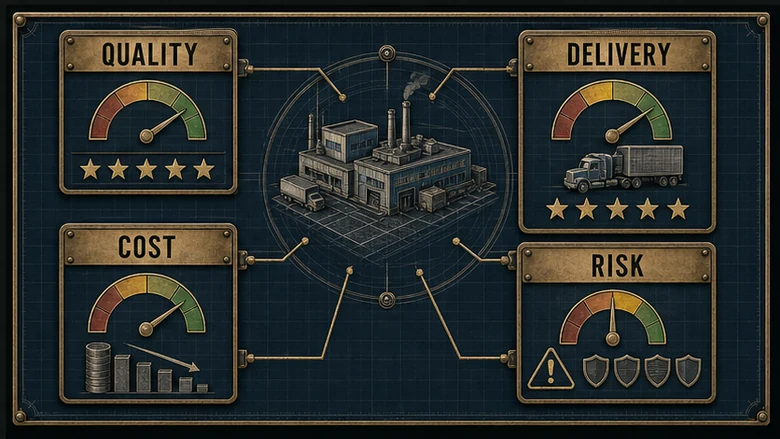
| Quality performance and system | 25 | PPM, escapes, audit results, control plan, corrective-action closure, certificates | Claims without records; weak containment | Stable evidence, capable controls, fast verified closure |
| Delivery and service | 20 | On-time-in-full history, lead-time variation, expedite rate, response times | Misses hidden by expedites | Consistent delivery with transparent exceptions |
| Total cost of ownership | 20 | Unit price, freight, duty, tooling, inventory, payment terms, escalation | Low quote with major excluded costs | Best normalized lifecycle value |
| Capacity and continuity | 15 | Constraint calculation, utilization, staffing, maintenance, alternate site, recovery plan | No quantified capacity or recovery route | Verified headroom and tested continuity plan |
| Technical capability | 10 | Comparable parts, process capability, engineering resources, validation plan | Unproven on critical features | Relevant evidence and credible industrialization plan |
| Enterprise and supply risk | 10 | Financial review, ownership, geography, sub-tiers, cybersecurity, compliance, concentration | Material unknowns or unmanaged concentration | Transparent risk map with funded mitigations |
Rate each criterion from one to five, multiply by its weight, and divide by five. A supplier scoring 4, 3, 4, 2, 5, and 3 across the rows earns 70 points: 20 + 12 + 16 + 6 + 10 + 6. Preserve the underlying notes and documents. “70” without evidence is false precision.
Quality data should remain connected to supplier, part, lot, and corrective action. A manufacturing quality management system can support that record, while a manufacturing ERP or inventory data supplies receipts and quantities. The sourcing decision still belongs to a cross-functional team; software organizes evidence but should not silently choose the weights.
Total cost of ownership can reverse the lowest bid
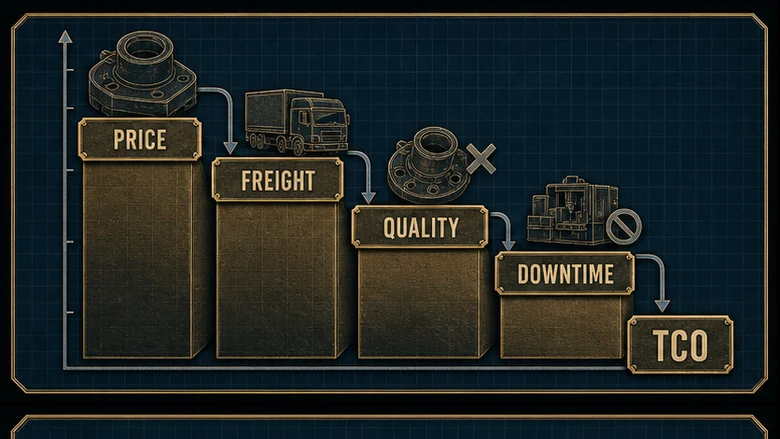
Consider an annual requirement of 100,000 parts. Supplier A quotes $9.40 each; Supplier B quotes $10.10. On unit price, A appears cheaper by $70,000. For this illustration, scrap and rework equal 6% of A’s purchase spend and 1% of B’s; premium freight assumes 12 expedites at $2,500 for A and four at $2,000 for B; disruption allowances are probability-weighted at 30% of a $150,000 event for A and 10% of a $100,000 event for B.
| Annual cost element | Supplier A | Supplier B |
|---|---|---|
| Purchase price | $940,000 | $1,010,000 |
| Incoming inspection | $12,000 | $5,000 |
| Expected scrap and rework | $56,400 | $10,100 |
| Premium freight | $30,000 | $8,000 |
| Expected disruption allowance | $45,000 | $10,000 |
| Modeled annual total | $1,083,400 | $1,043,100 |
Under those disclosed assumptions, B is $40,300 lower despite the higher quote. This is an illustrative decision model, not a benchmark: replace every number with the plant’s actual defect, labor, freight, inventory, warranty, downtime, and probability data. Also test a range rather than one forecast. If the winner changes under a small assumption shift, the decision is fragile and needs more evidence.
Price normalization should also include minimum order quantities, lead-time inventory, safety stock, duties, brokerage, packaging, tooling amortization, payment terms, engineering change costs, obsolescence, warranty recovery, and end-of-life commitments. These inputs often live across purchasing, quality, finance, and manufacturing inventory software; no single quote contains the full answer.
Assess supplier risk at the part and sub-tier level
A supplier marked “low risk” at company level can still be a single point of failure for one resin, chip, heat-treatment source, tool, person, plant, or transport lane. Map critical parts to the producing site, constraint equipment, important sub-tiers, alternate sites, qualification lead time, tooling ownership, and days of recoverable supply. The risk unit is the dependency, not the vendor logo.
NIST’s July 2026 supply-chain due-diligence guide describes supplier research through provenance, resilience, foundational cyber practices, foreign ownership or control, and supply-chain tiers. Its formal scope is information and communications technology, so it should not be copied blindly into a machining audit. The useful principle travels: due diligence must be proportionate to the consequence and visibility of the dependency.
Mitigations should name an owner, trigger, cost, and completion date. Options include dual qualification, approved substitute material, transferable tooling, alternate site validation, capacity reservation, targeted safety stock, demand shaping, redesign, supplier development, financial monitoring, cyber requirements, or a tested recovery plan. “Find a second supplier if needed” is not a mitigation until the alternate can make and ship an accepted part.
Manage the supplier after award
Move the bid baseline into an operating scorecard. Track supplier PPM or defect rate, on-time-in-full delivery, lead-time variation, expedite count, corrective-action aging, capacity commitments, cost performance, engineering responsiveness, and open risks. Use the same definitions at the receiving plant and supplier so a metric dispute does not consume the review.
Segment governance just as you segmented spend. A non-critical catalog supplier may need automated exception management. A high-impact, low-risk supplier may need quarterly commercial and forecast reviews. A strategic supplier may need monthly operating reviews, joint capacity work, executive sponsorship, and a shared improvement roadmap. Meeting frequency is not relationship quality; closed actions and improved outcomes are.
Vendor-managed inventory can be part of the awarded model when demand is visible, replenishment rules are stable, data is reliable, and ownership is explicit. It is not a substitute for supplier qualification. Giving a weak supplier authority to replenish only moves a sourcing failure closer to the line.
Common sourcing mistakes that look efficient
- Starting with incumbent names. This frames the event around history before the team defines the requirement or market.
- Scoring before gates. Weighted points should compare qualified choices, not average away a missing certification or impossible capacity plan.
- Using savings without a baseline. “Five percent saved” means little if volume, specification, freight, or payment terms changed.
- Accepting capacity percentages. Ask for the bottleneck calculation, shift pattern, scrap assumption, maintenance time, and surge route behind “80% loaded.”
- Dual-sourcing only on paper. An alternate without approved samples, tooling, data, and recurring volume may not respond during a disruption.
- Ending at signature. Unowned onboarding, master-data errors, and unclear scorecard definitions can destroy the value negotiated in the event.
A good sourcing file should let a reviewer reconstruct the decision months later: requirement, bidder list, communications, gates, evidence, score, total-cost model, risk assessment, approvals, contract, transition plan, and performance baseline. That audit trail is also the best defense against preference masquerading as strategy.
Frequently asked questions
Strategic sourcing is a structured process for analyzing spend, supply markets, supplier capability, total cost, and risk before selecting and contracting suppliers. It aligns the sourcing strategy with operating needs, applies qualification gates and evidence-based scoring, and continues through transition and supplier performance management.
Strategic sourcing is the upstream decision process: define the category, analyze the market, choose the supplier strategy, evaluate total value and risk, negotiate, and award. Procurement is broader and includes the day-to-day processes that execute buying, such as requisitions, purchase orders, receipts, invoice matching, payment, and supplier administration.
Set hard gates first, then use a weighted scorecard backed by evidence. Typical categories include quality performance, delivery, total cost, capacity and continuity, technical capability, and enterprise risk. Validate critical claims through records, samples, audits, references, financial checks, and a quantified capacity plan before final award.
The Kraljic matrix classifies purchase categories by business impact and supply risk into non-critical, high-impact/low-risk, bottleneck, and strategic quadrants. Each calls for a different strategy: simplify transactions, use competition, secure continuity, or build a governed partnership. Categories should be reassessed when demand, technology, or supply conditions change.
Total cost of ownership includes the quoted price plus the relevant costs of freight, duties, packaging, inventory, minimum orders, tooling, implementation, inspection, defects, rework, warranty, payment terms, engineering changes, obsolescence, expediting, and disruption. The exact model should use plant data and disclose assumptions rather than apply a generic percentage.
